 Photo of a New Zealand Forest, from
Permanent Forests NZ.
Photo of a New Zealand Forest, from
Permanent Forests NZ.
Next Generation Tracking Tunnel
Design Context
Note: This project was completed in a group. Two designs were created, detailed below is the design that I had the most influence on.
My Electrical and Computer Engineering Design Class tasked me and two others to create a modern tracking tunnel implementation for DOC (Department of Conservation).
Tracking tunnels, in general, are used to gather information regarding the species and number of animals in an area. DOC primarily uses them to track pests, in this case primarily stoats and rats. These animals pose a significant threat to endemic wildlife such as Kiwi and other native birds. Therefore, quickly and effectively gathering information about the number of pests in a given area is essential. As part of a next-generation design, we must retain the ability to accurately identify animals and count them, even in high traffic conditions.
The standard tracking tunnel is 100 mm x 100 mm x 615 mm and contains an ink pad and paper for animals to run over. They are baited on one end to encourage animals to move through the tunnel. As previously mentioned, this tracking method can be inaccurate and requires that someone regularly review the paper. Tracking tunnels are used extensively by DOC, and they suggest utilising anywhere from 6 – 20 depending on the amount of land DOC is surveying. Therefore, we designed the tracking tunnel to as economical and easily deployable as possible.
Design Requirements / Specifications
The base specification for a next generation tracking tunnel is provided below in Table 1.
| Inputs |
IR Sensor RangeAnalogue signal proportional to the distance to the nearest object in the range sensor field of view. Assuming that the sensor is pointed directly across the width of the tunnel, the" baseline" range will be approximately 10 cm, and a variation in the range away from the baseline will correspond to the presence of an animal. User ActionA physical action from the user that indicates that the display should turn on or off. |
|---|---|
| Outputs |
Camera TriggerA digital pulse intended to trigger a digital camera. DisplayVisual display of the current running total of animals counted IR Sensor Power: DC voltage to power the IR sensor. |
| Behaviours |
|
Hardware Design
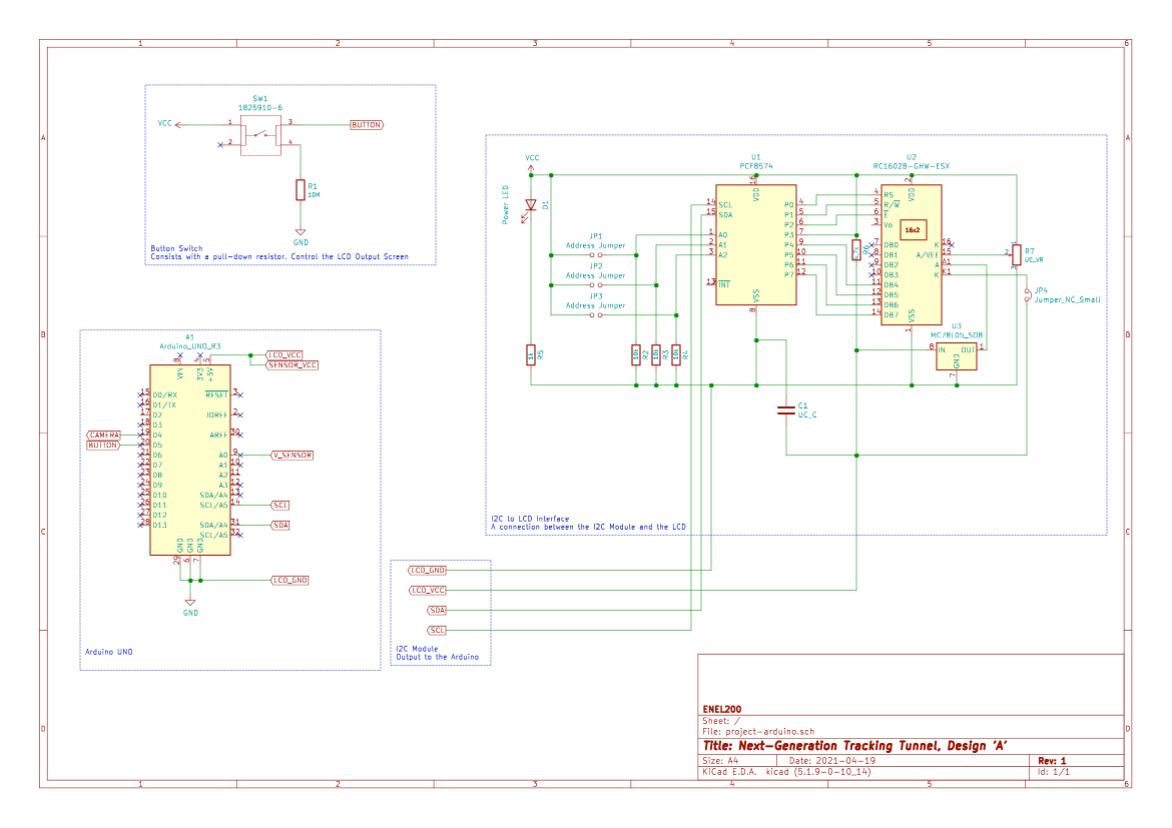 Figure 2: Schematic of the Design
The design consists of an Arduino Uno, Sharp GP2Y0A21YK0F IR Sensor, LCD, and push-button. The Arduino repeatedly polls the IR sensor to check if there has been the required deviation and adds an animal to the count. It also checks if the user has pressed the button to turn on the LCD, displaying the number of animals counted. If the user holds the button for long enough - 1500 milliseconds - the sensor will be recalibrated, allowing for variations in tunnel width and displaying "Reset" on the LCD. The schematic produced to implement the design can be seen in Figure 2.
Software Design
The software for the Arduino was written in C++ utilising Arduino libraries and a couple of external libraries. Despite the simple description, there are multiple complications. These were related to confidence in sensor readings and user interactions.
To improve the user interaction experience, we improved how the Arduino detected user interaction by increasing confidence that a user has initiated action while also simplifying the interaction. To enhance confidence in user initiation, we used "debouncing", a common technique to remove noise commonly associated with push buttons.
Debouncing is the process of removing bounces from a button when being pressed or released bounces referring to rapid transitions between 0 and positive voltage. Clean button presses require debouncing due to the possibility of button presses due to small positive voltage. Without debouncing, the button can trigger multiple times for each press, and in some rare cases, triggers without user interaction. We implemented debouncing through physical and software modifications. We used a "pulldown" resistor to reduce the impact of noise. We implemented a state change timer in the software to ensure that the button held a changed state for at least 50ms before registering the press.
This step makes it very unlikely that a quick change in voltage due to bouncing would register while not requiring the user to press the button longer than usual. To further improve the user interaction experience, we opted to remove the reset button and implement its functionality in a long press of the single push button. We found that 1500 ms was long enough to be intentional through testing but short enough not to frustrate the user.
We felt this was an important addition because leaving the LCD on, which could trivially happen during the day when it is not easily noticeable, could significantly impact the tracking tunnel's effectiveness at night. The removal of the switch exacerbates this issue. A switch indicates the need for the user to interact again to switch off the seven segment display in Design A, whereas a button does not offer the same indication.
To get the initial sensor reading, we used a GPIO pin to read the sensor's output. The sensor's output was converted to a discrete value by the Arduino's ADC. The ADC returned a value from 0 to 1023 due to the 10 bit ADC present in the Arduino. To convert this into an actual voltage, we used the following equations. To improve the sensor readings, we implemented a two-step process to filter out noise. We thought this was important because we found the sensor inaccurate at times, an experience not specific to us.
The first step involves polling (reading the sensor's voltage) multiple times and selecting the median. We implemented this process by using the SharpIR library provided by Guillaume Rico. We modified the library in two key ways:
- We changed the distance value the library returned to a floating-point number rather than an integer.
- We changed the equation used for the characteristic curve to our own.
We then implemented a process similar to button debouncing to improve confidience in the IR sensor readings. We checked to see if the sensor distance had varied by more than 5 mm for more than 100ms. This process was a convenient place to enforce the specification, but I should note that we could have reduced the time and checked for the specification requirements elsewhere in the code.
Conclusion
 Figure 3: Photo of completed prototype.
Overall, this was a fun project to do. You can see the final product below in Figure 3, considering that this is a prototype.
The prototype successfully implements all the required functionality and provides the groundwork for future development through software and hardware development. I learnt a lot about using an oscilloscope to debug issues with electrical circuits and got more experience programming an Arduino. I developed better delegation skills to work more effectively with team members and facilitate collaborative software development.
If I were to complete this project again, I would approach it differently. I would write the software in conjunction with hardware development instead of writing all the software initially then developing the hardware. Due to the latter approach, I encountered non-trivial bugs caused by complex code. By building both systems at the same time, I can test functionality as I add it.
What I've Learnt
Listed below are some learning highlights.
General
- I discovered testing techniques for hardware issues could either cause, for example, the sensor not being appropriately grounded and software issues.
C / C++ Programming
- I've gathered more experience working with the Arduino and the constraints it brings, such as limited memory and lack of the C++ standard library.
- I've attained more experience writing modular and extensible C code.
Arduino / Electronics
- I obtained more experience prototyping an electrical circuit on a breadboard.
- I learnt how to use a DSO-X 3012A oscilloscope to probe the IR sensor and camera trigger for debugging purposes.
- I got more experience reading analogue sensor information and converting that into usable information.